


Eight weeks in health data research: investigating seasonal patterns in prescribing
- Posted:
- Written by:
-
- Najma Moallin
- Categories:
When I graduated from the University of Reading with a degree in Economics, I knew I wanted to apply my quantitative skills to practical problems. I had experience using statistical methods to investigate relationships in data, and I was curious about how those skills could be applied to questions in health.
The HDRUK Black Internship programme gave me the opportunity to explore this interest through an eight-week placement as a Data Scientist at the Bennett Institute for Applied Data Science.
First impressions: working alongside researchers
One of the first things that struck me about the Bennett Institute was how welcoming everyone was. I had some preconceived ideas about what working with researchers at Oxford might be like, and I was initially quite intimidated. Instead, I found people incredibly kind and willing to help; their openness made it much easier to ask questions and become involved in conversations about their work.
I was lucky to have Colm Andrews and Lola Ojedele as my supervisors. From the beginning, both were generous with their time and made me feel comfortable asking questions, even when I was unsure whether they were worth asking. They helped me navigate the research itself, and gave me useful perspective on what it is like to start out in this kind of research environment.
As the project progressed, their support went beyond helping me with the technical side of the work; they also helped me through the less straightforward parts of research, including the decisions that researchers have to make when there is no obvious answer. That made a real difference to my experience, and helped me feel much less like I had to figure everything out on my own.
Additionally, being able to speak to researchers across the team gave me a much better understanding of what academia actually looks like. As someone early in her career, this was especially valuable. It can be difficult to know what direction you want to take when you are just starting out, so getting insight into the different types of research people were doing, and hearing about their own experiences, helped me think more clearly about what I might want to pursue in the future.
Learning to navigate uncertainty in research
Before starting this internship, I knew that I wanted to experience what research was actually like outside of studying at university. During my studies, I was used to being given a question, a dataset, and a method. I expected that working with real-world health data would involve more uncertainty, but I did not fully appreciate how much interpretation and judgement would be required.
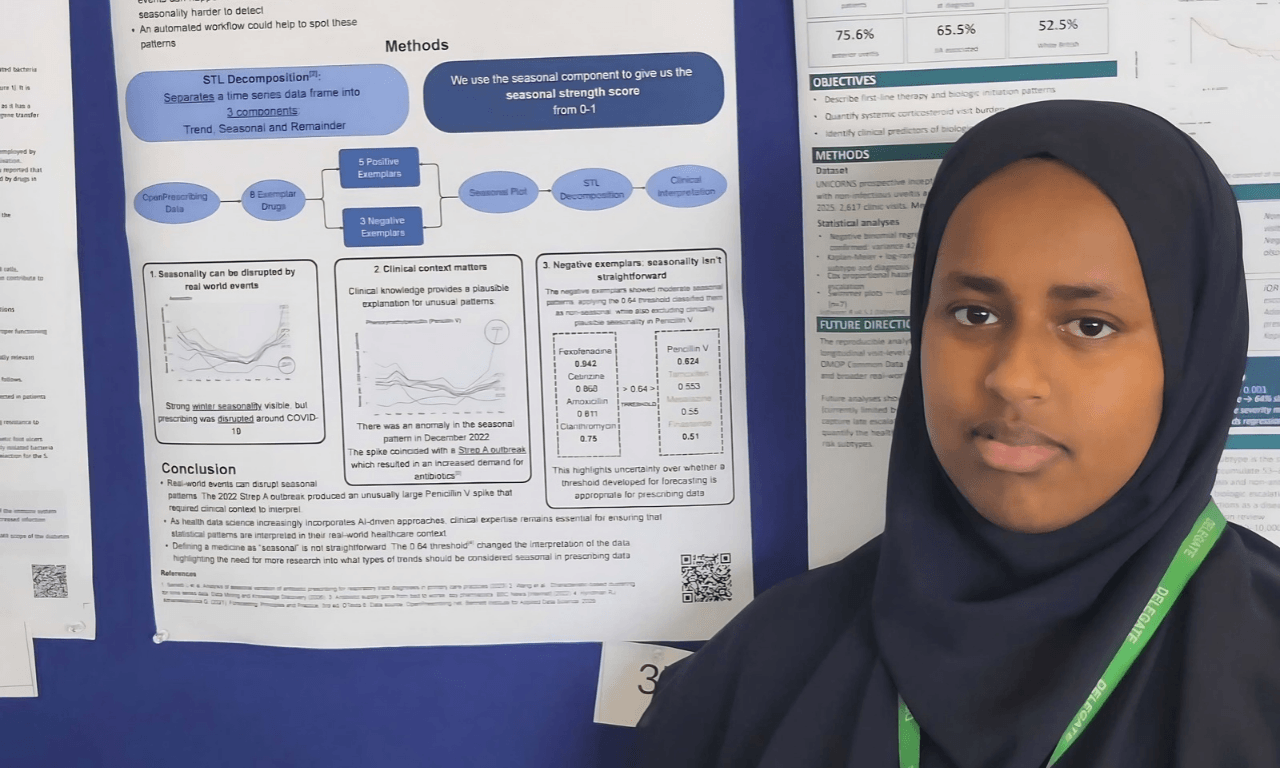
My project examined seasonal patterns in prescribing using OpenPrescribing. I investigated medicines for which seasonality seemed likely, alongside others where I did not expect to find a clear pattern.
The analysis involved time-series visualisations and STL decomposition, which generated a seasonal score from zero to one. Applying these methods to prescribing data raised questions that could not be answered by statistical techniques alone. Some patterns were clear, while others were more difficult to interpret. I had to consider whether an apparent trend was meaningful, how much confidence to place in it, and what the data could reasonably support.
Penicillin V provided a useful example of this. Prescribing increased sharply in December 2022, which initially stood out as an unusual feature of the data. Speaking to Caroline Acuda, one of the clinical researchers I worked with, helped me understand that this was not simply an unexplained anomaly. The increase coincided with the Strep A and scarlet fever outbreak that winter, when Penicillin V was commonly used to treat Group A Strep infections. What looked like an unusual change in prescribing made much more sense once I understood what was happening outside the dataset.
This showed me the importance of combining quantitative analysis with subject knowledge. A graph can reveal that prescribing changed, but understanding the circumstances behind that change requires input from people who know the clinical and public health context.
The project also didn’t go exactly according to plan. I followed several different lines of enquiry and encountered results that led me down a few rabbit holes. One of the hardest parts was deciding when something was worth investigating further, and when I needed to accept it as a limitation and move on.
I found those decisions surprisingly difficult. At times, I wondered whether this uncertainty meant that research wasn’t for me.
Talking to researchers helped me realise that this is not something you simply figure out once you become more experienced. Knowing what to investigate, where to spend your time and when to move forward is a skill that develops with practice. I felt reassured and now know how to navigate my development.
From research project to a top-10 poster
Another part of the internship I really enjoyed was communicating my work. I had the opportunity to present my project to researchers at the Bennett Institute and create a poster for the HDRUK Closing Ceremony. Seeing my poster selected among the top ten out of 110 HDRUK interns’ posters was a really rewarding way to finish the internship.
I came into the internship hoping to develop my experience with health data, R, and time-series analysis. I certainly did that, but I also came away with a much better understanding of the judgement, context, and decision-making that sits alongside the technical work.
Most importantly, I have a much clearer idea of what health data research actually looks like, and a better sense of where I might fit within it.
I am incredibly grateful to the HDRUK Black Internship programme and everyone at the Bennett Institute who made the experience so welcoming and gave me the opportunity to learn from them.