


- Posted
- Categories
-
- OpenPrescribing
OpenPrescribing Autumn 2023 Newsletter
OpenPrescribing Autumn 2023 Newsletter.
Latest news and views from around the Bennett Institute
OpenPrescribing Autumn 2023 Newsletter.

In this guest blog, Mark Russell describes the research that he has undertaken with the help of his team from King’s College London using OpenSAFELY.
Xiaomin Zhong, Ya-Ting Yang, Dr Ali Fahmi, Dr Victoria Palin and Professor Tjeerd Van Staa from Manchester University have been using OpenSAFELY for analyses focused on the impact of COVID-19 on antimicrobial resistance since 2021. In this guest blog they describe some of their recent papers that have been published in peer review journals.
In this blog, we describe how OpenPrescribing tools helped identify and investigate a sudden £450k per month increase in NHS expenditure

In this blog post Millie Green shares some of the findings from a federated analysis carried out using OpenSAFELY.

In this blog we explain what codelists are, how they are constructed and review existing literature on construction processes.
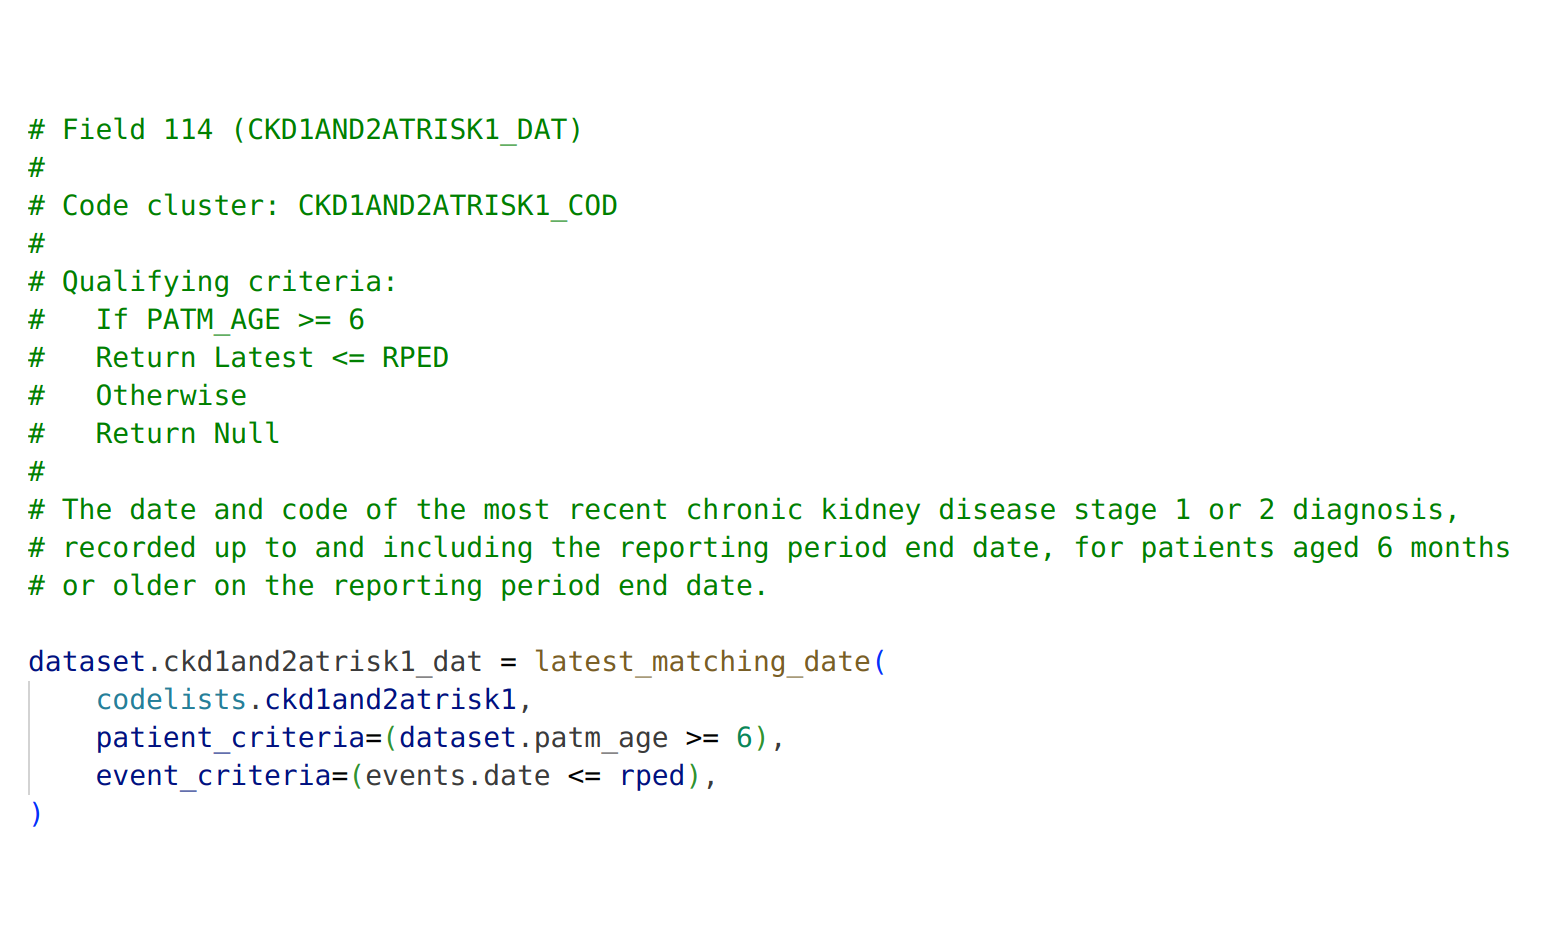
Why did we create a new query language?
The OpenSAFELY Collaborative has won a prestigious CogX Award for the Best Innovation in Open Source Technology

In this blog we describe how to use and access the NHS England Medicines Optimisation Oppurtunitites dashboard on OpenPrescribing

In this blog, we describe the development of a set of key measures used to monitor the ongoing impact of the COVID-19 pandemic on primary care as part of the OpenSAFELY Service Restoration Observatory (SRO). The results from this work have now been published in eLife.

Here we introduce the Bennett Institute’s Information Governance team, explaining who they are, and what they do.

Our new paper describes some of the biases that exist when estimating COVID-19 vaccine effectiveness using routinely-collected health data, and discusses the use of target trial emulation to avoid or mitigate these biases.

An introduction to what clinical codes are, why they are used and the terminology systems used within OpenSAFELY work.

A summary of our findings from running the OpenSAFELY output checking service.

Millie and Laurie share how some of the outputs from the work on COVID-19 therapeutics have been used to inform policy and guidelines in the NHS and beyond.
The latest paper from our NHS Service Restoration Observatory, examining changes in primary care activity over the pandemic was recently published in the British Journal of General Practice.
Introducing the Bennett Institute’s Product team, where we talk about who we are, what we do and how we work.

Our OpenSAFELY study describing patterns in COVID-19-related mortality in the first five pandemic waves is now published open-access in the Lancet Public Health.